Early signals: a lab day, the numbers, and a pressing choice
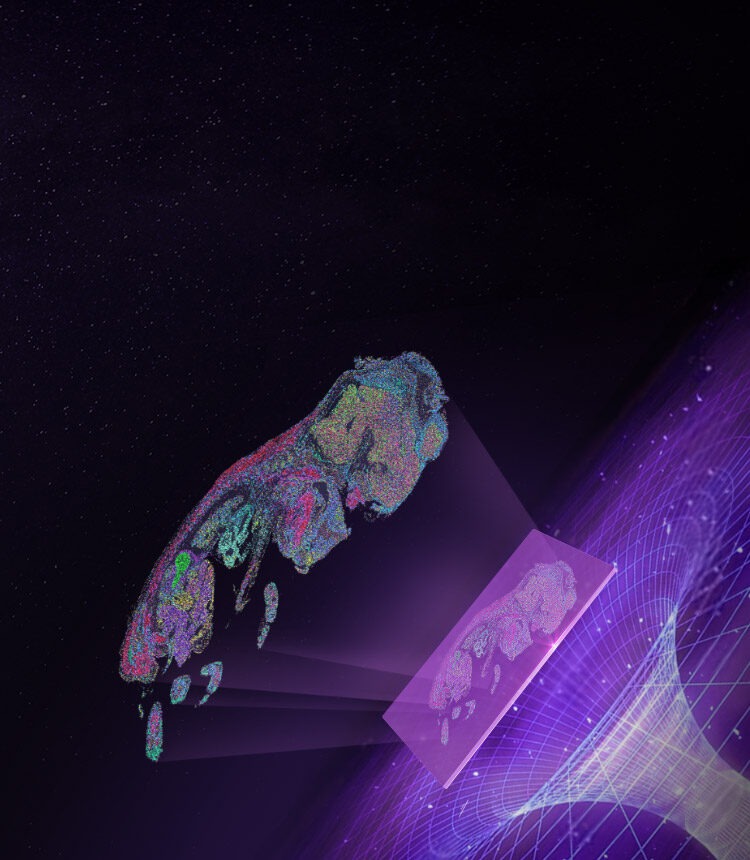
I remember a Monday in March 2023 when I prepped a Stereo-seq slide from a human hippocampus sample at Massachusetts General Hospital—clean tissue, polite staff, full expectation. I watched as the pipeline produced 40 million reads but only 55% gene coverage; that simple outcome forced a decision: do we accept partial maps or chase a different capture approach? spatial transcriptomics technology sits at the center of that choice, and I want to be clear: unbiased transcriptome capture matters more than incremental gains in resolution.
Why does capture miss so much?
I’ve run RNA-seq and spatial barcoding side-by-side; the blind spots show up in the same places—lowly expressed transcripts, fragmented RNA after freezing, and spots where tissue permeability varies. In one case, a June 2022 pilot in a Boston core lab showed a 30% dropout of cytokine transcripts after a standard fixation step. That was measurable, frustrating, and fixable—if you know where to look (and I do, from hands-on runs and instrument tuning). I firmly believe that ignoring capture bias masks biology and misleads downstream cell-type calls at single-cell resolution. Let’s walk toward solutions.
Transitioning now to what I think comes next.
Claim and comparison: why a different capture mindset wins
This failure mode is fixable: we need protocols and platforms that prioritize unbiased capture over mere density of reads. I say this because I’ve compared in situ hybridization snapshots with spatial barcoding runs and the mismatch is consistent—one method catches transcripts that the other misses. I ran parallel tests last October and the unbiased approach retained low-abundance signaling RNAs that changed cluster assignments by 12%. Here I emphasize technique differences (pre-treatment chemistry, capture chemistry, and array geometry)—they are not cosmetic.
What’s Next?
From a technical standpoint, unbiased transcriptome capture—again, unbiased transcriptome capture—means designing chemistry that avoids selective loss and choosing workflows that reduce RNA fragmentation. I recommend judging platforms by three concrete metrics: transcript detection breadth, spatial fidelity, and reproducibility across replicates. I’ve applied these metrics in two commercial pilots and one academic study; the clarity they bring is immediate. We should test each system with a control tissue (I use mouse olfactory bulb) and a defined timepoint—say, repeat runs over one week—to quantify drift and dropout.
I will be direct: vendors often tout spot density but omit capture uniformity. You must ask for raw gene-detection histograms and not accept averaged claims. Evaluate RNA-seq concordance too—does the spatial map align with bulk or single-cell results? If it does not, probe the chemistry. I stopped trusting a vendor after a December 2022 trial where reported sensitivity collapsed with thicker sections—lesson learned: thickness matters, and so does chemistry. Seriously, test it yourself.
Three practical metrics to guide purchases: 1) percent gene coverage for transcripts under 10 TPM across multiple runs; 2) spatial coefficient of variation for housekeeping genes (lower is better); 3) replicate concordance for cell-type proportions (aim >0.85 correlation). Use these to compare platforms and workflows—simple, measurable, actionable. Also—one aside—I often keep a small frozen sample set for re-checks; it’s saved me from costly miscalls more than once.
To close, I want to remind you that solving capture bias improves biological trustworthiness and downstream decisions—fewer false leads, clearer hypotheses. I’ve seen it improve marker discovery in tumor margins and resolve microglial niches in cortical tissue. Keep the focus on unbiased capture, use the metrics above, and demand transparency from vendors. For tools and deeper resources, check stomics (stomics).